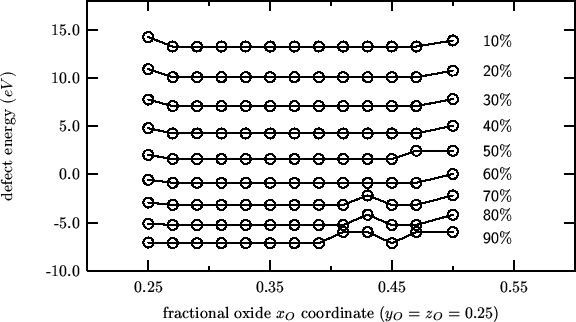
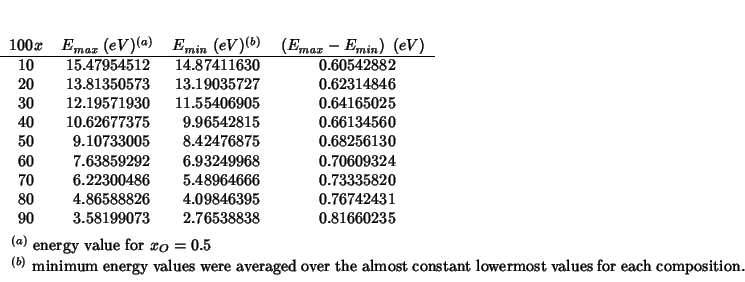
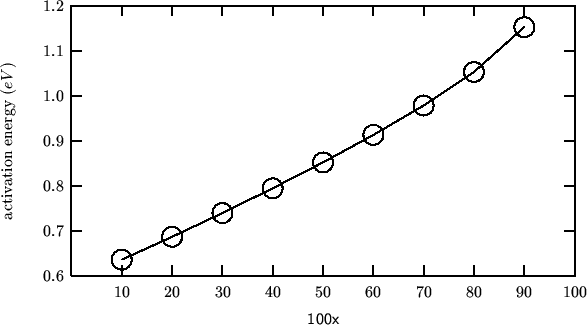
Evaluation of the activation energy for oxygen migration in
![]() as the difference between the
maximum and minimum energy values along the energy profile for a
migrating oxygen from
as the difference between the
maximum and minimum energy values along the energy profile for a
migrating oxygen from
![]() to
to
![]() .
.

NOTE: as with the other dopants, apparent irregularities can be observed for some compositions


opti conp defect
dump every 1 ca-fix-10-39.dump

maxcyc opt      200
maxcyc fit      200
title
Energy profile for oxygen migration
end

cell
   5.329267   5.329267   5.329267  90.000000  90.000000  90.000000

fractional    5
   Ce4  core  0.0000  0.0000  0.0000  -3.7000  0.9000  0.0000
    Ca  core  0.0000  0.0000  0.0000   2.0000  0.1000  0.0000
     O  core  0.2500  0.2500  0.2500   0.0770  0.9500  0.0000
   Ce4  shel  0.0000  0.0000  0.0000   7.7000  0.9000  0.0000
     O  shel  0.2500  0.2500  0.2500  -2.0770  0.9500  0.0000

space
225


size    10.38619969   21.81101935
centre          0.50   0.25   0.25
interstitial O  0.39   0.25   0.25  fix
vacancy         0.25   0.25   0.25
vacancy         0.75   0.25   0.25


buck
Ce4   shel O     shel  1986.8300     0.351070  20.400      0.000 15.000
Ca    core O     shel  1227.7        0.33720    0.000      0.0   15.0
O     shel O     shel 22764.300      0.149000  27.890      0.000 15.000
spring
Ce4    291.75000
O      27.290000