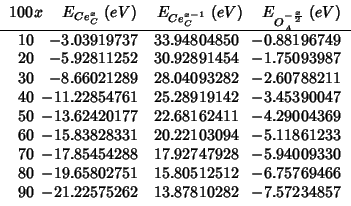
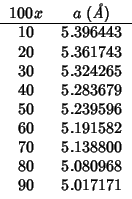
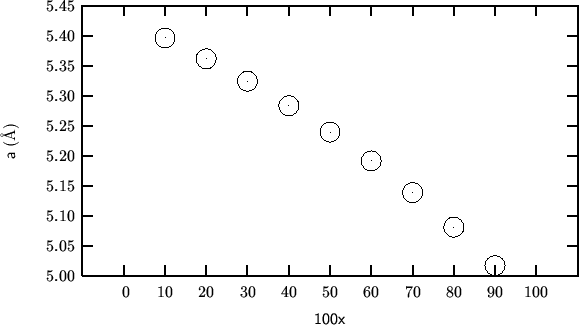
Calculations on the
![]() system: another
system: another ![]() dopant smaller than
dopant smaller than
![]() (
(
![]() ,
after Shannon (1976)) for which we have potential parameters
(from Lewis and Catlow (1985)) consistent with all other ones.
,
after Shannon (1976)) for which we have potential parameters
(from Lewis and Catlow (1985)) consistent with all other ones.
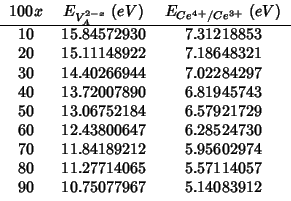
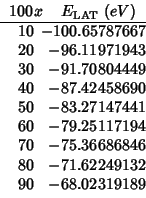
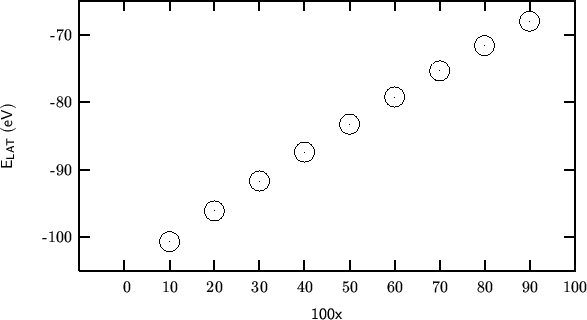
The
![]() reduction energy was evaluated according to
the procedure outlined in section 2000-08-10. Notation is the same.
reduction energy was evaluated according to
the procedure outlined in section 2000-08-10. Notation is the same.
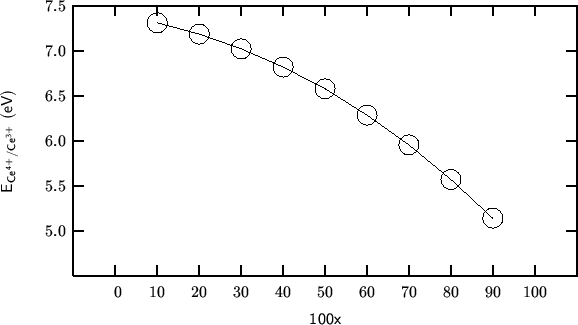
In the following figure we compare the
![]() reduction
energy as a function of the fraction of oxygen vacancies in the
structure (and NOT as a function of dopant composition) for the
different dopants. Subscripts are the effective ionic radii of the
dopants for 8-coordination, according to Shannon (1976):
reduction
energy as a function of the fraction of oxygen vacancies in the
structure (and NOT as a function of dopant composition) for the
different dopants. Subscripts are the effective ionic radii of the
dopants for 8-coordination, according to Shannon (1976):
No comparison with Kim's empirical equation (Kim, 1989), as we have already seen that the accord does not seem to be very good in the other cases.
opti conp defect

maxcyc opt      200
maxcyc fit      200
dump every   1 ce3-50.dump
title
Ce3+ impurity
end

cell
   5.329267   5.329267   5.329267  90.000000  90.000000  90.000000

fractional    5
   Ce4  core  0.0000  0.0000  0.0000  -3.7000  0.5000  0.0000
    Sc  core  0.0000  0.0000  0.0000   3.0000  0.5000  0.0000
     O  core  0.2500  0.2500  0.2500   0.0770  0.8750  0.0000
   Ce4  shel  0.0000  0.0000  0.0000   7.7000  0.5000  0.0000
     O  shel  0.2500  0.2500  0.2500  -2.0770  0.8750  0.0000

space
225

size 10.00000000  21.00000000
centre          0.00 0.00 0.00
impurity  Ce3   0.00 0.00 0.00

species   2
Ce3    core   -4.700000
Ce3    shel    7.700000

buck
Ce4   shel O     shel  1986.8300     0.351070   20.400     0.000 15.000
Sc    core O     shel  1299.4        0.33120     0.000     0.0   15.0
Ce3   shel O     shel  1731.6181     0.363720   14.433     0.000 15.000
O     shel O     shel 22764.300      0.149000   27.890     0.000 15.000
spring
Ce4    291.75000
Ce3    291.75000
O      27.290000