next up previous contents
Next: 2000-07-17: ceria- Up: Aliovalent cation doped ceria Previous: 2000-07-10: reproducing data from #grimes:1999###


2000-07-12: convergence tests for 2000-07-10

GOAL

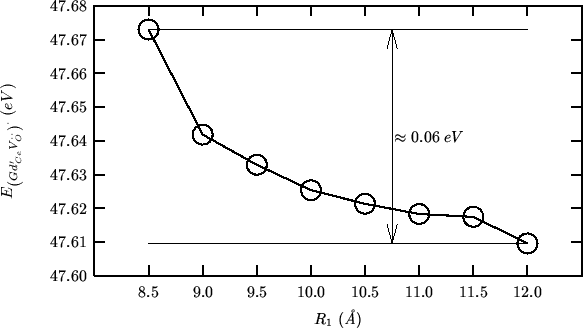
Just to see whether increasing region 1 radius makes the comparison with figure 2 of reference (Minervini et al., 1999) better.

Results

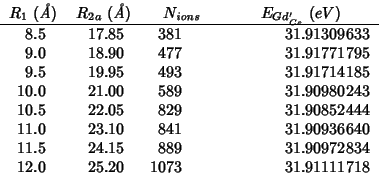
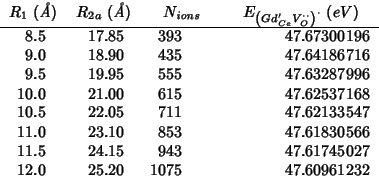
For the $Gd$ doped system, a series of calculations of $E_{Gd_{Ce}^\prime}$ and $E_{\left(Gd_{Ce}^\prime{}V_O^{\cdot\cdot}\right)^\cdot}$ was performed at increasing region 1 radius. Region 2a radius was set at $2.1\times{}R_1$

\begin{tabular}{D{.}{.}{-1}D{.}{.}{-1}D{.}{.}{-1}D{.}{.}{-1}}
\multicolumn{1}{c}...
....15 & 889 & 31.90972834 \\
12.0 & 25.20 & 1073 & 31.91111718 \\
\end{tabular}

\begin{tabular}{D{.}{.}{-1}D{.}{.}{-1}D{.}{.}{-1}D{.}{.}{-1}}
\multicolumn{1}{c}...
....15 & 943 & 47.61745027 \\
12.0 & 25.20 & 1075 & 47.60961232 \\
\end{tabular}

\begin{center}\vbox{\input{2000-07-12-01.pslatex}
}\end{center}

\begin{center}\vbox{\input{2000-07-12-02.pslatex}
}\end{center}